Dashboard Reports is a powerful feature within OnSpace that enables you to create comprehensive, customizable dashboards by aggregating data from one or multiple forms. Through the use of pivot tables, charts, and stats or metrics cards, you can visualize your data in meaningful ways. This feature is designed to help you quickly analyze your data, uncovering trends and insights that inform better decisions. Whether you're evaluating customer feedback, monitoring project progress, or reviewing any other form-based data, Reports turns raw data into actionable intelligence.

Creating a dashboard report involves selecting the forms you wish to analyze, by first aggregating data from single or multiple forms on a pivot table then choosing the type of visualization (pie chart, bar chart, or metrics card), and customizing the elements to highlight the data you're interested in. OnSpace's user-friendly interface guides you through each step.
Yes, you can aggregate data from single form or better multiple forms, giving you a comprehensive view of the information you need to analyze.
Highly customizable. You can adjust the type of chart, the data points to include, the labels to ensure your report communicates the insights most effectively.
Absolutely. You can generate shareable links, embed links to your website or export reports in various formats like CSV and PDF to ensure stakeholders can access the insights, regardless of whether they have an OnSpace account.
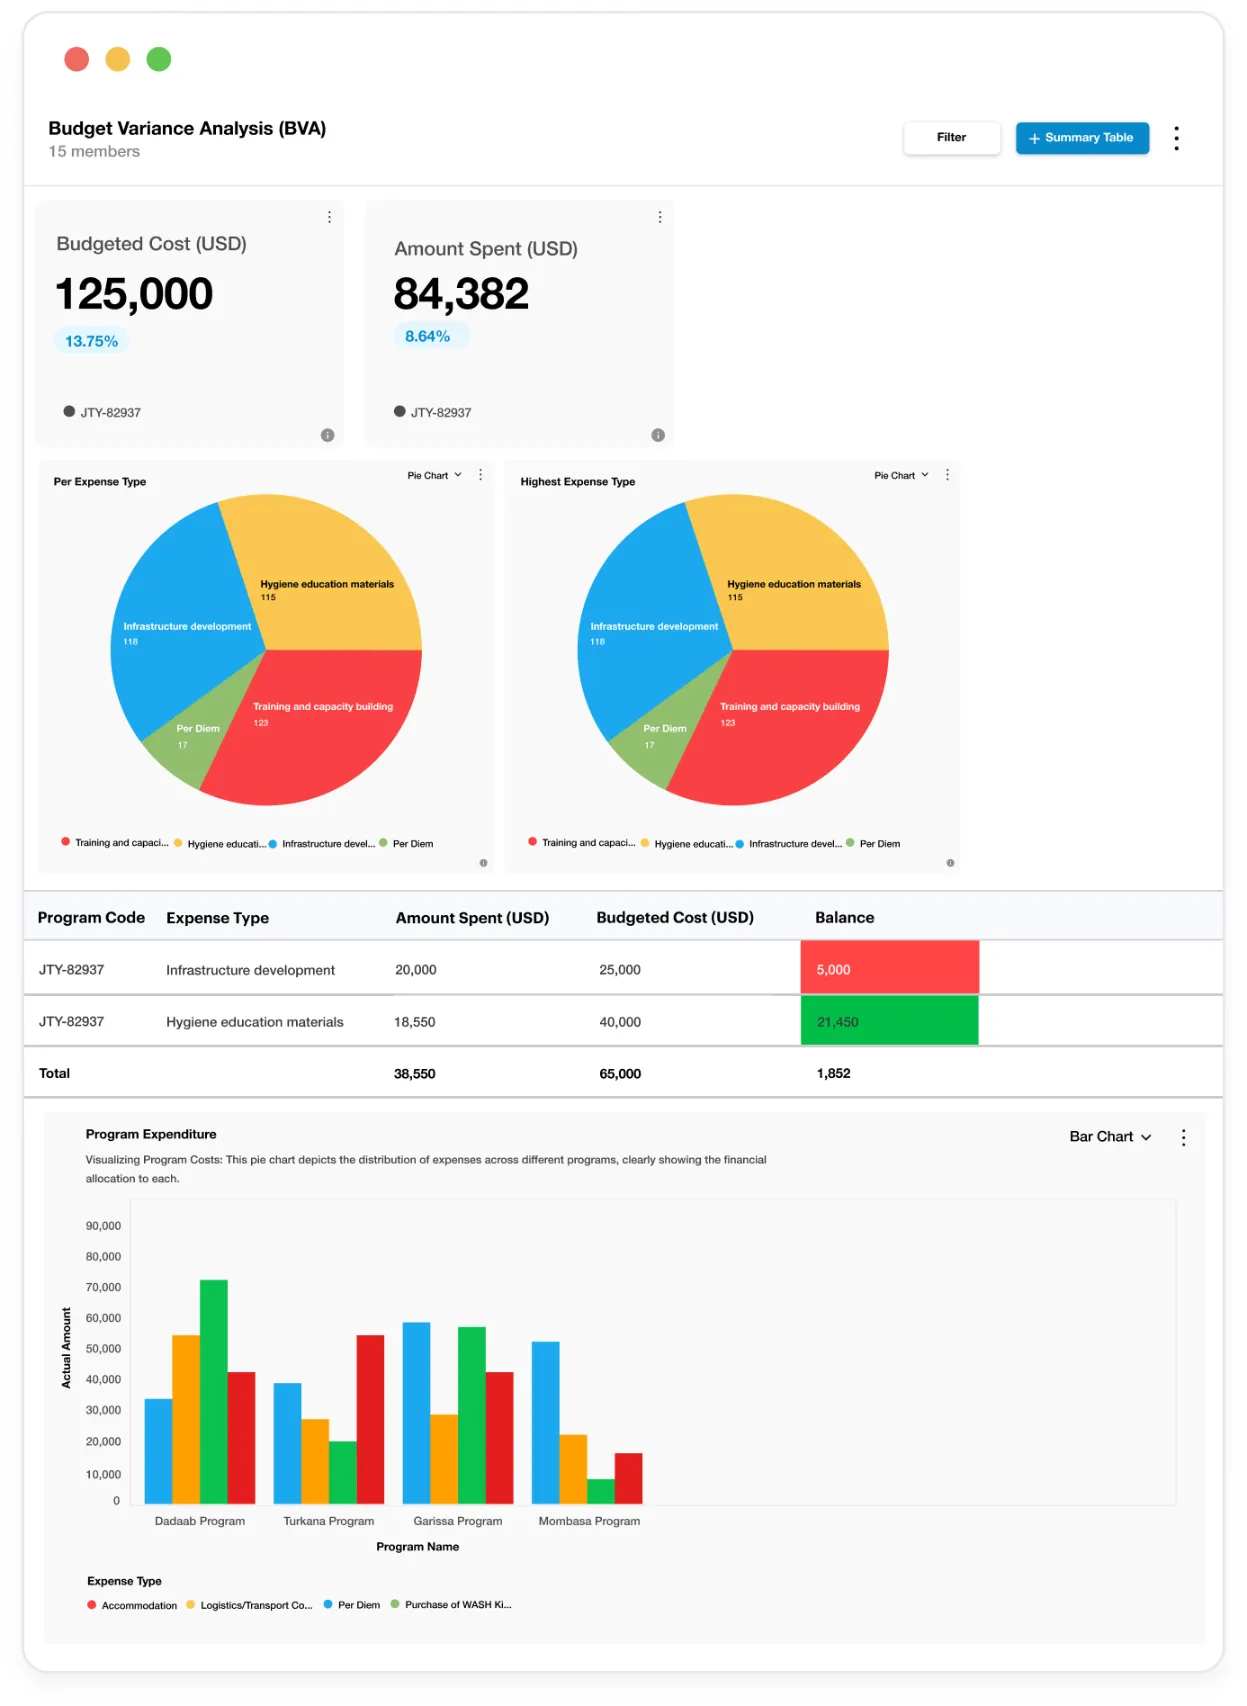
Metrics cards provide at-a-glance insights into key data points, such as total responses, average scores, or custom metrics relevant to your analysis, making it easier to quickly assess performance or trends.
No, the reports automatically update or adjust in real-time as data are submitted through their respective OnSpace forms. With this capability you and your team can make informed decisions instantly.
By providing a clear, visual representation of your data, OnSpace dashboard report helps you identify trends, patterns, and outliers that could influence your decisions. This insight enables more strategic planning, better resource allocation, and improved outcomes.
Work better with your teams and gain valuable insights. Get started for free. Add as many users as you want, all for free.